
On This Page: [hide]
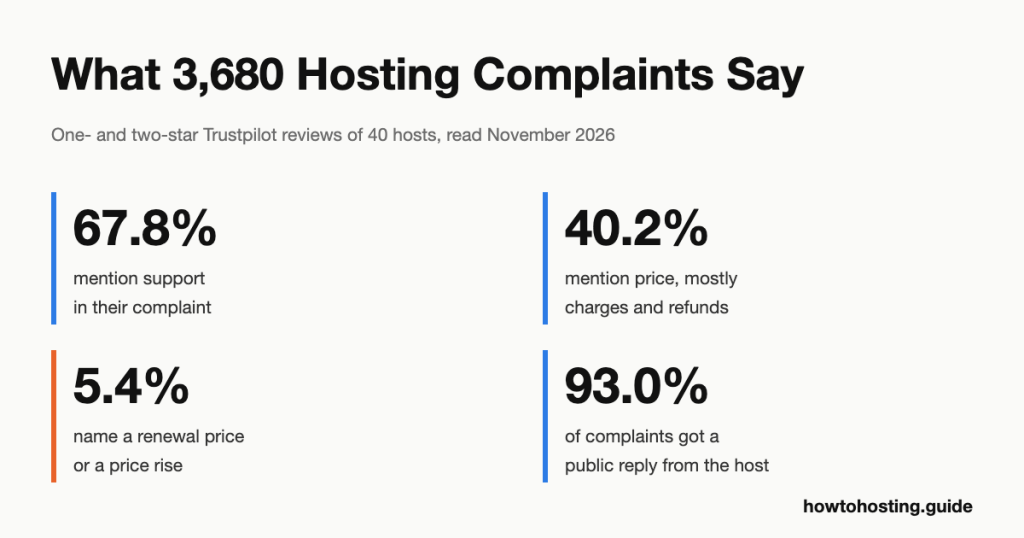
Two out of three angry hosting reviews mention support, and fewer than half mention price. We collected 3,680 one- and two-star Trustpilot reviews of 40 web hosts, all posted in the last 12 months. A keyword script sorted every one into themes, and we checked 400 by hand. The pattern held for budget hosts, cloud providers and domain registrars alike.
Quick answer: Support comes up in 67.8% of complaints, price in 40.2% and uptime in just 16.0%. Most price complaints are about charges and refunds; only 5.4% name a renewal price or a price rise. Hosts replied to 93.0% of complaints, and invited reviews averaged 4.83 stars against 3.65 for unprompted ones.
| Theme | Complaints that mention it | Highest share (20+ complaints) | Lowest share |
|---|---|---|---|
| Support | 2,495 (67.8%) | InMotion Hosting 87.5% | names.co.uk 50.9% |
| Price | 1,478 (40.2%) | Hetzner 54.5% | Infomaniak 15.4% |
| Uptime | 588 (16.0%) | Verpex 44.8% | DigitalOcean 5.0% |
| Slow site | 87 (2.4%) | Too few to rank | Too few to rank |
We counted Trustpilot’s own data on the 40 hosts with the most reviews in the past year; here is exactly how.
Last reviewed: November 2026. Review data collected and prices verified on 19 November 2026.
Jump to: Method | Support | Uptime | Price | By host type | Invited vs unprompted | Replies | Hetzner’s price rises | Before you buy | Full data | FAQ
Where the Numbers Come From
This study counts one review platform, Trustpilot, so every host is measured the same way. We didn’t use other review sites, and we skipped Reddit because its search showed a CAPTCHA to automated browsers last month.
Three different numbers sit behind this page, and they count different things:
- 3,680 complaints read. These are English one- and two-star reviews published between 19 November 2025 and 19 November 2026. A script sorted their text into themes, and we checked a sample by hand. Every percentage about support, uptime or price comes from this set.
- 7,999 newest reviews sorted by source. For each host we took its 200 newest reviews in any language and noted the star rating and whether the host invited the reviewer. We used only their rating and source, not their text.
- 584,207 star ratings counted. That’s the lifetime total of one- to five-star ratings across the 40 profiles, taken from Trustpilot’s own star counts. These say nothing about what people wrote.
Which hosts made the cut
We started from the 382 customer-review pages on this site. We shortlisted 68 that looked large and checked each one’s main Trustpilot profile by hand. Then we kept the 40 web hosts with the most reviews in the last 12 months. The smallest, ScalaHosting, had 292.
Several big names fell out. Wix, Squarespace and WordPress.com sell website builders, not hosting, and BisectHosting and ZAP-Hosting are game-server hosts. A2 Hosting’s profile now redirects to Hosting.com, and Nexcess redirects to Liquid Web. Seven more cleared 100 reviews a year but missed the top 40, including GreenGeeks (281) and iPage (148). Fifteen fell under 100, among them HostArmada (64) and Hostwinds (26).
Brands often run several profiles. IONOS, for example, has separate ones for the US, UK, Germany, France, Spain, Italy and Mexico. We used one main profile per host and listed the siblings in our research notes.
How much text each host contributed
Trustpilot shows at most 200 rows for any filtered list, so busy hosts give a short window. Hostinger’s 200 newest English complaints cover only 10 October to 18 November 2026. GoDaddy’s cover four weeks. Smaller hosts reach back the full year, which also means fewer complaints: 11 hosts had under 20, so they get counts, never percentages.
Each English filter also drops non-English reviews. That’s why STRATO and Aruba, with mostly German and Italian reviewers, gave us only 12 complaints each.
The codebook and the hand check
Before reading any review, we wrote a keyword codebook. It has three main themes (support, uptime and price), each split into sub-themes, plus slow sites as a separate theme and five smaller ones. A script in our own workspace applied it. One review can carry several themes.
Then we checked it by hand. We read a random sample of 150 labelled reviews and 50 unlabelled ones, judging every label. The first version labelled renewal complaints badly: it was right only 36.4% of the time, because any review mentioning a renewal counted. We revised the codebook once and checked the new version on a fresh random sample of 200.
The revised version was right 87.5% of the time on support labels, 96.8% on uptime and 95.7% on price. Its weak spot is short reviews. In the fresh sample, 28 of the 50 unlabelled reviews did raise a main theme. The keywords missed phrases such as a one-line “it renewed anyway”. So treat the uptime and price shares below as floors. Corrected for the hand check, they come to about one in five and just under half. The support share runs a few points high instead, because its wrong labels outnumber its misses.
Politeness and limits
We made about 760 page requests to Trustpilot on 19 November 2026, one at a time with a pause of several seconds. Trustpilot never blocked us or showed a CAPTCHA.
The biggest limit is self-selection. People who write a one-star review chose to. So a theme share tells you what complainers mention, not how often customers hit the problem. A host with 60% billing complaints doesn’t bill 60% of customers wrongly. We also read only English reviews, and we tested nothing ourselves: no sign-ups, no uptime monitoring, no support tickets.
Support Complaints: Two in Three Mention It
Support shows up in 2,495 of the 3,680 complaints. That makes it the default way an unhappy customer describes a hosting problem, whatever the problem started as. An outage becomes a support complaint once nobody answers for a day.
The sub-themes show what went wrong with the help itself:
- Unresolved: 1,071 complaints (29.1%) say support couldn’t or didn’t fix the issue, or sent the same scripted answer again.
- Slow reply: 756 (20.5%) describe waiting hours or days, or tickets that went unanswered.
- Escalation: 385 (10.5%) mention managers, supervisors or being passed between teams.
- AI or bot first: 238 (6.5%) complain about a chatbot or AI agent.
- No phone: 127 (3.5%) say they couldn’t call or reach a human.
Note what’s small. “No phone” is the rarest support complaint we track. Unresolved problems outnumber missing phone lines more than eight to one.
The AI-first cluster at Hostinger
AI support complaints aren’t spread evenly. Hostinger alone supplied 73 of the 238, which is 36.5% of its 200 complaints. SiteGround came second at 15.6% (25 of 160). No other host with 20 or more complaints passed 11%.
There’s a dated reason. Hostinger’s own blog, published on 2 September 2026, says its support moved to a specialist-guided AI model “at the end of June”. It reports that live chat demand fell from 10% to 4.5% after the change. Its help centre adds that “Hostinger doesn’t offer phone support”. One reviewer put the result bluntly: “Trying to get their AI to solve a problem is like jamming a square peg through a round hole.”
Hostinger’s sample covers only 10 October to 18 November, so all of it postdates the switch. We can’t compare before and after from these 200 rows. Our Hostinger review covers what the support model means for its plans.
Support channels next to the complaint shares
Does a phone line keep support complaints down? We checked the support pages of the three hosts with the highest support share and the three with the lowest.
| Host | Support share | Channels on its own support page (19 Nov 2026) |
|---|---|---|
| InMotion Hosting | 87.5% (42 of 48) | 24/7 chat and ticket; phone 9 AM to 9 PM ET, Monday to Friday |
| BigRock | 86.0% (43 of 50) | Two support phone numbers and a 24/7 support link |
| Infomaniak | 82.1% (32 of 39) | Phone Mon-Fri 9-18, chat Mon-Fri 6-19, email 7 days 6-21 |
| Namecheap | 56.5% (113 of 200) | 24/7 live chat and email; no phone line listed |
| IONOS | 54.5% (109 of 200) | Phone 24 hours a day, 7 days a week |
| names.co.uk | 50.9% (59 of 116) | Phone and ticket weekdays 8am to 5:30pm; ticket only at weekends |
The pairing doesn’t line up the way forum wisdom suggests. All three hosts with the highest support share list a phone number. Namecheap, which lists none, sits near the bottom. Six hosts can’t show cause in either direction, though. What they do show is that a phone line on the contact page doesn’t keep support out of the complaints.
Uptime Complaints: Rarer Than You’d Think
Only 588 complaints (16.0%) mention downtime, an unreachable site or a server error. That’s the smallest of the three main themes by a wide margin. Even so, our hand check suggests it’s the most undercounted, so the real share is probably closer to one in five.
Most uptime complaints describe a site or server simply being down (481, or 13.1% of all complaints). Another 146 (4.0%) say the site wouldn’t load or couldn’t be reached. Named server errors such as a 503 or “bad gateway” turn up in just 29.
Slow sites are their own, much smaller theme: 87 complaints (2.4%). That’s too few to rank hosts, and the hand check found this label hard to get right. Still, the signal is clear. For all the marketing about speed, almost nobody writes a one-star review about it.
The median host had 18.2% uptime complaints. The extremes are wide. Verpex had 13 of its 29 complaints about outages (44.8%), while DigitalOcean had 3 of 60 (5.0%). A Krystal customer, one of only 7 in our Krystal sample, wrote that “The advertised 99.97% uptime is laughable based on my experience.”
Uptime promises next to the complaint shares
We took the three hosts with the most uptime complaints and the three with the fewest. Then we read their uptime terms and looked for a public status page.
| Host | Uptime share | What its terms say | Public status page |
|---|---|---|---|
| Verpex | 44.8% (13 of 29) | “We endeavour to provide a 99.9% service uptime”; no credit stated | Yes |
| MilesWeb | 27.9% (12 of 43) | Site advertises 99.9% uptime; the only SLA linked covers dedicated servers | Behind a security check we didn’t pass |
| Hosting.com | 26.6% (33 of 124) | Targets 99.9%; credit of 5% of the monthly fee per full hour down, capped at one month | Yes |
| IONOS | 6.0% (12 of 200) | “May offer” a 99.99% guarantee; credit at IONOS’s “sole discretion”, not cash | Yes |
| one.com | 5.9% (9 of 152) | Homepage promises 99.9%; its terms contain no uptime figure | Yes |
| DigitalOcean | 5.0% (3 of 60) | 99.99% per Droplet; below that, a 100% credit for the affected Droplet | Yes |
The best-written promise sits with the fewest complaints: DigitalOcean’s 99.99% per Droplet, with a full credit for a breach. But one.com draws almost as few uptime complaints while its terms promise nothing at all. And Verpex, with the most, says only that it will “endeavour”. The written SLA (service level agreement) and the complaint share don’t move together in any simple way.
Price Complaints: Billing Hurts More Than Renewals
Price comes up in 1,478 complaints (40.2%). Renewal hikes get the headlines in hosting reviews, including ours. In what customers actually write, they’re a minor part of the money story.
Here are the price sub-themes, each as a share of all 3,680 complaints:
- Billing: 988 (26.8%). Charges after cancelling, auto-renewals people didn’t expect, double charges, cards that couldn’t be removed, and money held during account checks.
- Refunds: 564 (15.3%). Refunds refused, delayed or limited to part of the term.
- Renewal or price rise: 198 (5.4%). The renewal price itself, or a price increase.
- Hidden fees: 152 (4.1%). Restore fees, add-ons and forced upgrades. Our hand check found this label right only about half the time, so read it as a rough count.
Two-thirds of price complaints mention a charge or invoice. Not the price tag. Only 13.4% of them name a renewal price or price rise. “I didn’t want to renew and somehow it renewed anyway” is a far more typical complaint than “the renewal price doubled”.
There’s one clear exception. At names.co.uk, 21 of 116 complaints (18.1%) name a renewal price or price rise, the highest share of any host with 20 or more complaints. One wrote that its “renewal rates are massively extortionate”. Its Beginner web hosting plan costs GBP 0.99 for the first month, then GBP 9.99 a month, before VAT. The basket also notes “Automated renewal by Credit/Debit Card”.
Prices next to the complaint shares
We took the three hosts with the most price complaints and the three with the fewest. For each, we checked the entry plan of its main hosting line. That means shared hosting for most hosts, including the domain-led ones, and servers for the server companies.
| Host | Price share | Entry plan and price | Renewal |
|---|---|---|---|
| Hetzner | 54.5% (109 of 200) | Dedicated server from EUR 59.00 / USD 69.00 a month, plus EUR 39.00 / USD 44.00 setup | Same monthly price; no introductory rate |
| DigitalOcean | 53.3% (32 of 60) | Basic Droplet USD 4.00 a month, billed per second | No term, so no renewal price |
| names.co.uk | 52.6% (61 of 116) | Web Hosting Beginner GBP 0.99 first month, ex VAT | GBP 9.99 a month (10.1x) |
| InterServer | 18.2% (10 of 55) | Cloud VPS, 1 slice, USD 3 a month | Monthly; no introductory rate shown |
| InMotion Hosting | 16.7% (8 of 48) | Launch USD 4.99 a month on 36 months (pre-sale) | USD 13.99 a month (2.80x) |
| Infomaniak | 15.4% (6 of 39) | Web hosting from CHF 10.91 a month, ex VAT | No introductory rate shown |
This is the most counter-intuitive pairing in the study. Two of the three hosts with the highest price share, Hetzner and DigitalOcean, have no renewal jump at all. Their price complaints are about charges and blocked accounts: 91 of Hetzner’s 200 complaints mention billing, and so do 30 of DigitalOcean’s 60.
Meanwhile InMotion, whose Launch plan renews at 2.80 times its pre-sale price, has one of the lowest price shares. InMotion’s Black Friday sale cut Launch to USD 3.49 a month on a three-year term until 1 December 2026, renewing at the same USD 13.99. Its cart on 19 November also preselected a USD 107.64 backup add-on, which nearly doubled the default three-year total to USD 233.28. Our InMotion Hosting review covers its plans and terms.
Six hosts can’t prove that flat pricing causes billing complaints, and we don’t claim it. What the data does show is narrower. A host’s renewal multiplier tells you little about whether its customers will complain about money.
Shared, Server and Domain-Led Hosts Draw Different Complaints
We grouped hosts by the product their own homepage leads with. Shared and WordPress hosts (22) lead with hosting plans. Server hosts (8) lead with VPS, cloud or dedicated servers. Domain-led hosts (10) lead with domains or a website builder, as GoDaddy, Namecheap and Network Solutions do.
| Host type | Complaints read | Support | Uptime | Price | Account blocks | Domains | Reply rate |
|---|---|---|---|---|---|---|---|
| Shared and WordPress (22 hosts) | 1,604 | 69.3% | 18.7% | 38.3% | 9.1% | 12.6% | 97.6% |
| VPS, cloud and dedicated (8) | 904 | 71.2% | 15.9% | 43.1% | 16.7% | 2.9% | 82.6% |
| Domain-led (10) | 1,172 | 63.1% | 12.3% | 40.4% | 6.3% | 21.9% | 94.7% |
The three main themes barely move between types. The differences sit in the smaller themes. Server hosts draw nearly twice the shared hosts’ share of account-block complaints: suspended servers, closed accounts and orders held for identity checks. DigitalOcean (18 of 60), Hetzner (55 of 200) and netcup (19 of 133) lead that list. Hostinger is the shared host with the most, at 50 of 200.
Domain-led hosts, unsurprisingly, draw the most domain complaints: transfers, expiries and DNS. They also draw the fewest uptime complaints. The type shares are pooled, so a host with 200 complaints weighs more than one with 40.
Across individual hosts, the spread is far wider than across types. The median host with 20 or more complaints had 69.0% support, 18.2% uptime and 36.8% price complaints. Support is the most-mentioned theme at 28 of those 29 hosts. The exception is names.co.uk, where price (52.6%) edges out support (50.9%). The chart shows all 29, which together supplied 3,585 of the complaints.
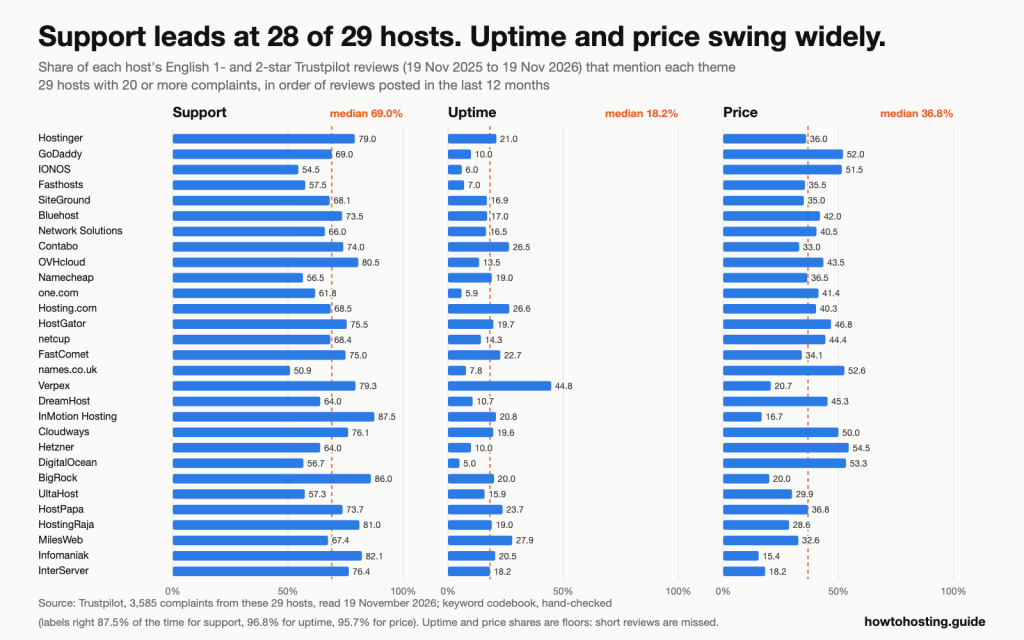
Support is the top theme at every host except names.co.uk. Uptime runs from 5.0% to 44.8% of complaints and price from 15.4% to 54.5%. Source: Trustpilot reviews read 19 November 2026, our keyword coding.
Invited vs Unprompted Reviews: Two Different Crowds
Trustpilot sorts reviews by how they arrived. Its help article “How do reviews get on Trustpilot?” calls reviews written without an invitation “Unprompted reviews”. It says they “are considered organic feedback”. Reviews the business prompted carry one of three labels. Verified means Trustpilot’s automatic invitations sent them, and Invited means the business sent them manually or through its own system. Redirected means the reviewer clicked a link on the business’s website.
We grouped all three prompted labels as “invited”, since the business started the contact each time. That includes reviews written after following a link on the host’s own website.
Across the 7,999 newest reviews, the two groups barely look like the same customers:
- Invited: 5,340 reviews averaging 4.83 stars; 91.7% five-star and 2.3% one-star.
- Unprompted: 2,659 reviews averaging 3.65 stars; 62.0% five-star and 29.6% one-star.
The gap holds in English alone: 4.84 against 3.70. And 82.4% of the complaints in our sample were unprompted.
That isn’t evidence of fakery. Trustpilot says automatic invitations go out after a purchase or after using a service, so they catch customers on a normal day. Unprompted reviews come from people who went looking for Trustpilot, which is mostly what you do when something broke. Trustpilot’s own “How Trustpilot works” page makes the same point: “the least happy customers are often most motivated to write unprompted feedback”. It adds that “invited reviews are subject to the same fraud detection and moderation as any other reviews”.
The gap varies hugely by host. Among the 32 hosts with at least 20 reviews in each group, it ranges from 0.15 stars at Fasthosts to 3.28 at DigitalOcean. At DigitalOcean, 177 invited reviews averaged 4.98 while 23 unprompted ones averaged 1.70. IONOS (4.81 against 1.60) and Hostinger (4.90 against 1.79) aren’t far behind. Our DigitalOcean review looks at what sits behind those unprompted scores.
Where most reviews are unprompted, the score sits closer to what angry and happy walk-ins both say. DreamHost’s newest 200 were 83.0% unprompted, and those averaged 4.36. At Hetzner, 79.0% were unprompted, averaging 1.87, and its TrustScore is 2.9.
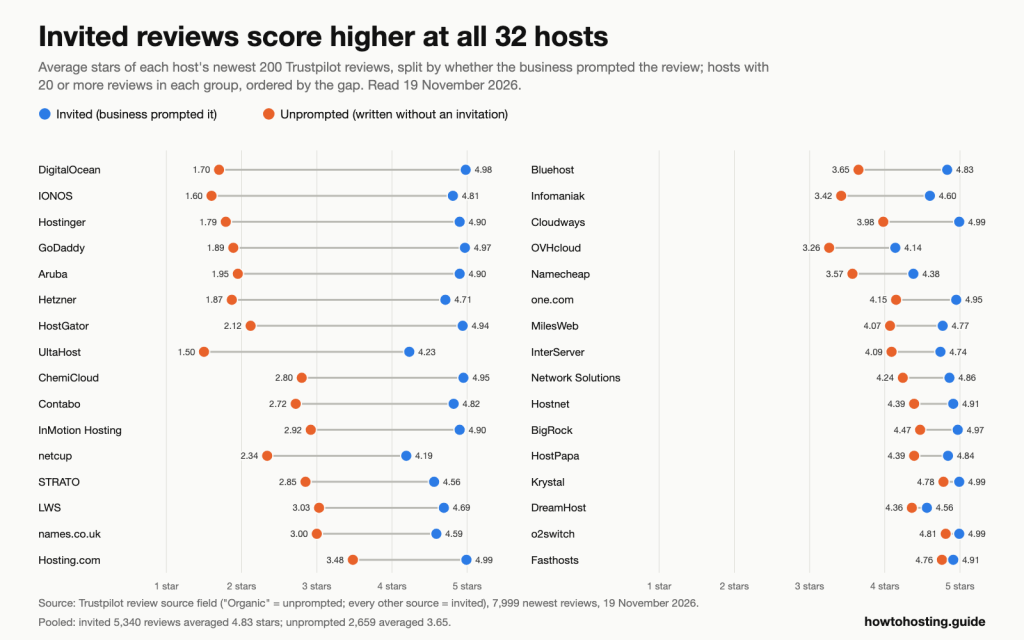
The widest gaps are at DigitalOcean, IONOS and Hostinger, the narrowest at Fasthosts, o2switch and DreamHost. Source: each host’s newest 200 Trustpilot reviews, read 19 November 2026.
The full figures for those 32 hosts, ordered by the size of the gap:
| Host | Invited (count, average) | Unprompted (count, average) | Gap in stars |
|---|---|---|---|
| DigitalOcean | 177, 4.98 | 23, 1.70 | 3.28 |
| IONOS | 175, 4.81 | 25, 1.60 | 3.21 |
| Hostinger | 175, 4.90 | 24, 1.79 | 3.11 |
| GoDaddy | 155, 4.97 | 45, 1.89 | 3.08 |
| Aruba | 178, 4.90 | 22, 1.95 | 2.95 |
| Hetzner | 42, 4.71 | 158, 1.87 | 2.84 |
| HostGator | 176, 4.94 | 24, 2.12 | 2.82 |
| UltaHost | 176, 4.23 | 24, 1.50 | 2.73 |
| ChemiCloud | 170, 4.95 | 30, 2.80 | 2.15 |
| Contabo | 153, 4.82 | 47, 2.72 | 2.10 |
| InMotion Hosting | 175, 4.90 | 25, 2.92 | 1.98 |
| netcup | 127, 4.19 | 73, 2.34 | 1.85 |
| STRATO | 133, 4.56 | 67, 2.85 | 1.71 |
| LWS | 168, 4.69 | 32, 3.03 | 1.66 |
| names.co.uk | 169, 4.59 | 31, 3.00 | 1.59 |
| Hosting.com | 144, 4.99 | 56, 3.48 | 1.51 |
| Bluehost | 108, 4.83 | 92, 3.65 | 1.18 |
| Infomaniak | 40, 4.60 | 160, 3.42 | 1.18 |
| Cloudways | 144, 4.99 | 56, 3.98 | 1.01 |
| OVHcloud | 37, 4.14 | 163, 3.26 | 0.88 |
| Namecheap | 110, 4.38 | 90, 3.57 | 0.81 |
| one.com | 62, 4.95 | 138, 4.15 | 0.80 |
| MilesWeb | 81, 4.77 | 119, 4.07 | 0.70 |
| InterServer | 50, 4.74 | 150, 4.09 | 0.65 |
| Network Solutions | 86, 4.86 | 114, 4.24 | 0.62 |
| Hostnet | 45, 4.91 | 155, 4.39 | 0.52 |
| BigRock | 127, 4.97 | 73, 4.47 | 0.50 |
| HostPapa | 87, 4.84 | 113, 4.39 | 0.45 |
| Krystal | 164, 4.99 | 36, 4.78 | 0.21 |
| DreamHost | 34, 4.56 | 166, 4.36 | 0.20 |
| o2switch | 158, 4.99 | 42, 4.81 | 0.18 |
| Fasthosts | 179, 4.91 | 21, 4.76 | 0.15 |
Who Answers Complaints
Hosts replied publicly to 3,422 of the 3,680 complaints, or 93.0%. The median reply came 19.1 hours after the review. Hosting.com (0.7 hours), Verpex (0.9) and Namecheap (1.0) were fastest at the median.
Three hosts answered far less often than the rest:
- OVHcloud replied to 118 of 200 complaints (59.0%), with a median wait of 91.7 hours.
- DigitalOcean replied to 37 of 60 (61.7%), at 92.6 hours.
- netcup replied to 85 of 133 (63.9%), and its median reply took 324.1 hours, about two weeks.
All three are server hosts, and they pull the server group’s reply rate down to 82.6%, against 97.6% for shared hosts. Among the hosts with fewer than 20 complaints, NameHero answered 4 of 14 and Krystal 2 of 7.
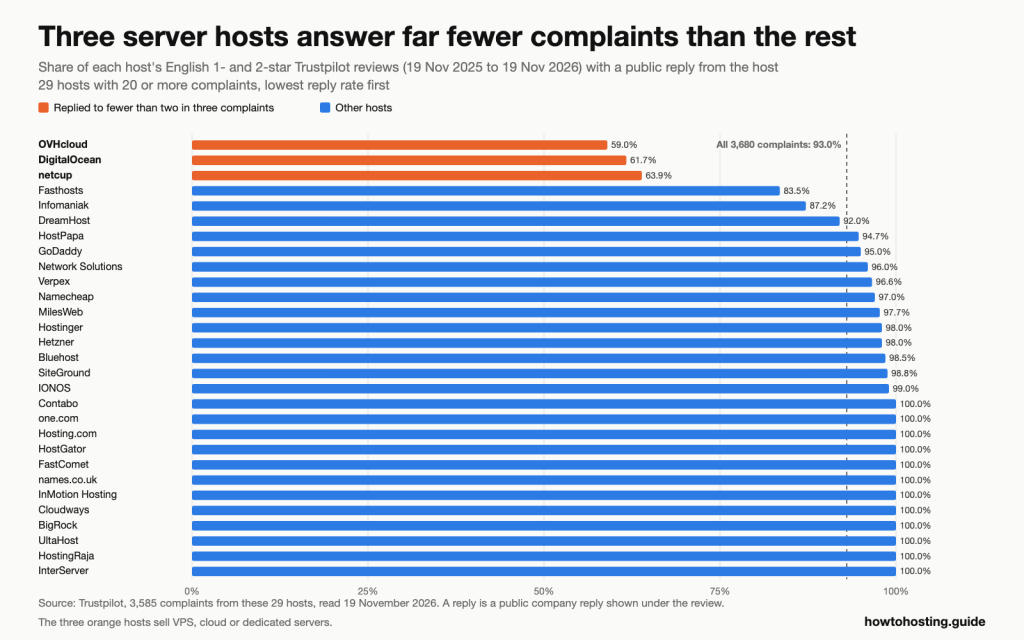
OVHcloud, DigitalOcean and netcup are the only hosts below 80%, while 12 hosts answered every complaint. Source: Trustpilot reviews read 19 November 2026.
A reply isn’t a fix, and many replies are template apologies with a ticket request. But an unanswered complaint does tell a buyer something. Nobody at the company was watching that channel.
Hetzner’s Two 2026 Price Rises in the Complaint Data
Hetzner raised prices for existing servers and new orders on 1 April 2026, then raised new-order prices again on 15 June 2026. Its press statement of 23 February said the April change “will affect both existing products and new orders”. The second, dated 27 May, said “All dedicated servers and cloud plans at all locations are affected”.
Both dates fall inside our Hetzner sample, which runs from 4 January to 18 November 2026. So we counted its English one- and two-star reviews month by month. January is cut short by the 200-row limit, so it’s left out of the comparison. Most months fall below 20 complaints, so these are counts, not shares.
- March: 23 complaints; April: 15. No jump after the rise that hit existing customers.
- June: 19 complaints, 16 mentioning price or billing, the highest share of any month. Only 3 named a price rise.
- August: 31, the peak, but 12 of those were about blocked or closed accounts.
- Across the whole window, including January, 11 complaints named a price rise or a renewal price.
The price rises barely surface in what Hetzner’s unhappy customers wrote. Its complaints are about billing and accounts. “Good hardware, ruined by poor billing” is how one reviewer summed it up. That’s a description of what customers mention, not proof the rises made no difference. People who left over price may never have written a review. Our Hetzner review covers the current plans.
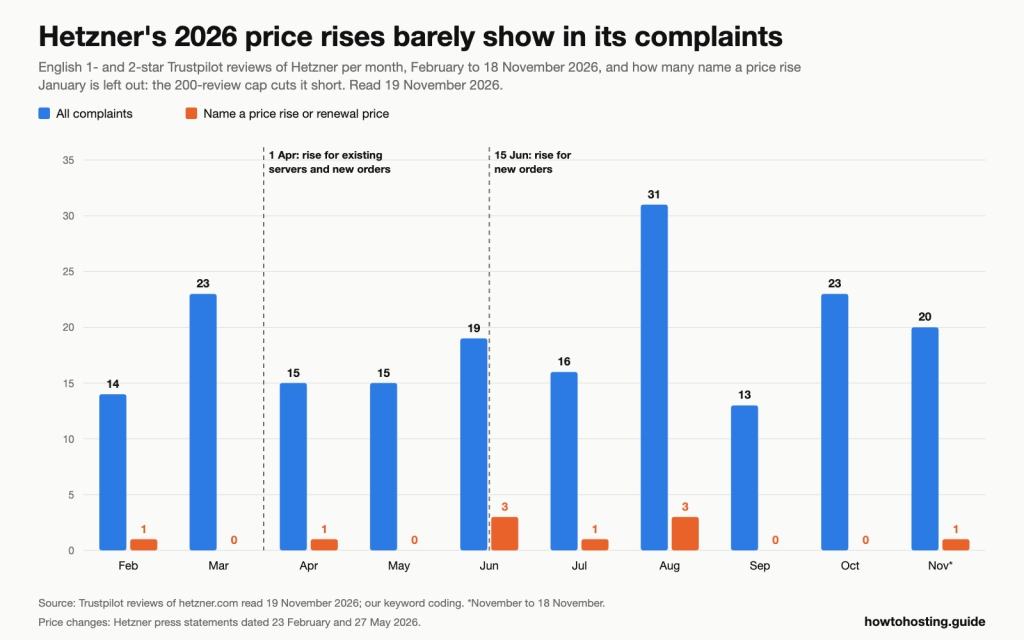
Neither the 1 April nor the 15 June price change brought a jump in complaints naming a price rise. Source: Trustpilot reviews of Hetzner read 19 November 2026; Hetzner press statements.
| Month (2026) | Complaints | Mention price or billing | Name a price rise or renewal price |
|---|---|---|---|
| February | 14 | 6 | 1 |
| March | 23 | 8 | 0 |
| April | 15 | 6 | 1 |
| May | 15 | 10 | 0 |
| June | 19 | 16 | 3 |
| July | 16 | 10 | 1 |
| August | 31 | 16 | 3 |
| September | 13 | 6 | 0 |
| October | 23 | 14 | 0 |
| November (to 18th) | 20 | 13 | 1 |
How to Read a Host’s Reviews Before You Buy
A TrustScore compresses two crowds into one number. These checks use the patterns above, and each takes a few minutes on the host’s Trustpilot page.
Invited share above 80%: If most of a host’s newest reviews were invited, filter to unprompted reviews before you trust the score. At Hostinger (87.9% invited) and IONOS (87.5%), the unprompted ones averaged 1.79 and 1.60. At Fasthosts (89.5% invited), unprompted reviews still averaged 4.76, so a high invited share alone isn’t a red flag. The unprompted average is the number to compare.
A site that earns hourly: filter one- and two-star reviews and count how many say “down” or “offline”. Our median host sat at 18.2%. Above about 25%, as at Verpex, MilesWeb, Hosting.com and Contabo, read the uptime terms before you buy. “Endeavour to provide” with no credit, as at Verpex, means the terms promise nothing if it fails.
A VPS bought by card: count account-block and billing complaints, not renewal ones. At DigitalOcean and Hetzner, roughly half of all complaints mention billing and more than a quarter mention blocked accounts. Many of those complaints describe identity checks, so have proof of who you are ready before you migrate anything important.
Needing a human fast: look for complaints about bots or AI agents. More than 30% is a warning sign; Hostinger sat at 36.5%. Check the reply rate too. If a host answered fewer than two in three complaints, as OVHcloud, DigitalOcean and netcup did, plan on a ticket queue.
Few recent complaints: check how far back 20 complaints reach. A host with fewer than 20 in a year can’t give you a share. Read every complaint instead.
The Full Data: 40 Hosts
Hosts are in order of reviews posted in the last 12 months. Shares are of each host’s complaints read, and a share appears only where we have at least 20. Below that, the table gives the count. “Invited share” covers the newest 200 reviews in any language.
| Host | Type | Lifetime reviews | TrustScore | Last 12 months | Invited share (newest 200) | Complaints read | Support | Uptime | Price | Reply rate |
|---|---|---|---|---|---|---|---|---|---|---|
| Hostinger | Shared | 74,247 | 4.6 | 17,116 | 87.9% | 200 | 79.0% | 21.0% | 36.0% | 98.0% |
| GoDaddy | Domain-led | 145,697 | 4.4 | 16,116 | 77.5% | 200 | 69.0% | 10.0% | 52.0% | 95.0% |
| IONOS | Shared | 45,969 | 4.6 | 9,663 | 87.5% | 200 | 54.5% | 6.0% | 51.5% | 99.0% |
| Fasthosts | Domain-led | 23,019 | 4.8 | 8,601 | 89.5% | 200 | 57.5% | 7.0% | 35.5% | 83.5% |
| SiteGround | Shared | 31,793 | 4.9 | 6,498 | 97.0% | 160 | 68.1% | 16.9% | 35.0% | 98.8% |
| Bluehost | Shared | 32,369 | 4.4 | 5,525 | 54.0% | 200 | 73.5% | 17.0% | 42.0% | 98.5% |
| Network Solutions | Domain-led | 17,895 | 4.3 | 5,102 | 43.0% | 200 | 66.0% | 16.5% | 40.5% | 96.0% |
| Contabo | Server | 11,791 | 4.6 | 4,154 | 76.5% | 200 | 74.0% | 26.5% | 33.0% | 100.0% |
| OVHcloud | Server | 9,273 | 3.8 | 4,022 | 18.5% | 200 | 80.5% | 13.5% | 43.5% | 59.0% |
| Aruba | Shared | 12,026 | 4.6 | 3,321 | 89.0% | 12 | 9 of 12 | 1 of 12 | 2 of 12 | 12 of 12 |
| Namecheap | Domain-led | 22,267 | 4.2 | 3,273 | 55.0% | 200 | 56.5% | 19.0% | 36.5% | 97.0% |
| one.com | Domain-led | 25,667 | 4.4 | 2,941 | 31.0% | 152 | 61.8% | 5.9% | 41.4% | 100.0% |
| Hosting.com | Shared | 7,347 | 4.8 | 2,483 | 72.0% | 124 | 68.5% | 26.6% | 40.3% | 100.0% |
| HostGator | Shared | 18,113 | 4.6 | 2,313 | 88.0% | 188 | 75.5% | 19.7% | 46.8% | 100.0% |
| STRATO | Domain-led | 10,928 | 4.2 | 1,726 | 66.5% | 12 | 11 of 12 | 3 of 12 | 3 of 12 | 12 of 12 |
| netcup | Server | 3,224 | 3.7 | 1,254 | 63.5% | 133 | 68.4% | 14.3% | 44.4% | 63.9% |
| o2switch | Shared | 5,285 | 4.8 | 1,039 | 79.0% | 3 | 2 of 3 | 1 of 3 | 0 of 3 | 2 of 3 |
| NameHero | Shared | 5,620 | 4.9 | 1,018 | 90.5% | 14 | 9 of 14 | 3 of 14 | 4 of 14 | 4 of 14 |
| FastComet | Shared | 4,194 | 4.8 | 936 | 93.5% | 44 | 75.0% | 22.7% | 34.1% | 100.0% |
| names.co.uk | Domain-led | 6,232 | 4.3 | 881 | 84.5% | 116 | 50.9% | 7.8% | 52.6% | 100.0% |
| Verpex | Shared | 1,925 | 4.8 | 813 | 95.0% | 29 | 79.3% | 44.8% | 20.7% | 96.6% |
| DreamHost | Shared | 8,317 | 4.6 | 694 | 17.0% | 75 | 64.0% | 10.7% | 45.3% | 92.0% |
| InMotion Hosting | Shared | 3,075 | 4.6 | 652 | 87.5% | 48 | 87.5% | 20.8% | 16.7% | 100.0% |
| Cloudways | Server | 3,806 | 4.6 | 606 | 72.0% | 46 | 76.1% | 19.6% | 50.0% | 100.0% |
| Hetzner | Server | 3,056 | 2.9 | 603 | 21.0% | 200 | 64.0% | 10.0% | 54.5% | 98.0% |
| eUKhost | Shared | 5,649 | 4.9 | 590 | 6.0% | 5 | 3 of 5 | 0 of 5 | 1 of 5 | 5 of 5 |
| DigitalOcean | Server | 2,648 | 4.6 | 589 | 88.5% | 60 | 56.7% | 5.0% | 53.3% | 61.7% |
| BigRock | Domain-led | 815 | 4.7 | 569 | 63.5% | 50 | 86.0% | 20.0% | 20.0% | 100.0% |
| UltaHost | Shared | 1,956 | 3.7 | 522 | 88.0% | 164 | 57.3% | 15.9% | 29.9% | 100.0% |
| HostPapa | Shared | 3,115 | 4.6 | 492 | 43.5% | 38 | 73.7% | 23.7% | 36.8% | 94.7% |
| HostingRaja | Shared | 1,261 | 4.8 | 489 | 96.5% | 21 | 81.0% | 19.0% | 28.6% | 100.0% |
| MilesWeb | Shared | 13,574 | 4.7 | 443 | 40.5% | 43 | 67.4% | 27.9% | 32.6% | 97.7% |
| LWS | Shared | 6,619 | 4.5 | 420 | 84.0% | 3 | 2 of 3 | 0 of 3 | 0 of 3 | 3 of 3 |
| Infomaniak | Domain-led | 2,110 | 3.9 | 418 | 20.0% | 39 | 82.1% | 20.5% | 15.4% | 87.2% |
| Hostnet | Domain-led | 2,640 | 4.5 | 415 | 22.5% | 3 | 2 of 3 | 0 of 3 | 1 of 3 | 3 of 3 |
| Krystal | Shared | 2,495 | 4.9 | 401 | 82.0% | 7 | 5 of 7 | 2 of 7 | 3 of 7 | 2 of 7 |
| TMDHosting | Shared | 1,830 | 4.8 | 337 | 92.0% | 8 | 5 of 8 | 4 of 8 | 3 of 8 | 6 of 8 |
| ChemiCloud | Shared | 1,426 | 4.7 | 328 | 85.0% | 18 | 13 of 18 | 12 of 18 | 3 of 18 | 18 of 18 |
| InterServer | Server | 2,532 | 4.2 | 294 | 25.0% | 55 | 76.4% | 18.2% | 18.2% | 100.0% |
| ScalaHosting | Server | 2,402 | 4.8 | 292 | 97.0% | 10 | 5 of 10 | 3 of 10 | 4 of 10 | 10 of 10 |
Type follows the product each homepage leads with. Complaints read are English one- and two-star reviews from 19 November 2025 to 19 November 2026, capped at 200 per host. Lifetime reviews, TrustScore and last-12-month counts are Trustpilot’s own figures, read on 19 November 2026.
Frequently Asked Questions
Which web host gets the most complaints?
By raw volume, GoDaddy. Trustpilot shows 2,474 English one- and two-star reviews for it in the last 12 months, against 1,331 for Hostinger. But volume follows size, since GoDaddy also drew 16,116 reviews of all kinds in that year. Compare unprompted averages instead: UltaHost (1.50), IONOS (1.60) and DigitalOcean (1.70) scored lowest in our sort.
Is Hostinger’s support worse since it switched to AI?
We can’t measure before and after, because Hostinger’s 200 newest complaints all date from 10 October to 18 November 2026. In that window, 36.5% mentioned AI or a bot, the highest of any host. Hostinger says you can still ask for a human specialist on any plan. If phone support matters to you, IONOS answers by phone 24 hours a day.
Is DigitalOcean or Hetzner safer if I’m worried about my account being blocked?
Neither does well on this measure. Blocked or closed accounts came up in 30.0% of DigitalOcean’s 60 complaints and 27.5% of Hetzner’s 200. Complaints at both describe identity checks on new accounts. DigitalOcean also replied to only 61.7% of complaints, against Hetzner’s 98.0%.
Can I trust a host’s 4.6 TrustScore?
Trust it as a measure of invited customers’ mood, not as a complaint rate. Among the newest reviews we sorted, invited ones averaged 4.83 and unprompted ones 3.65. Filter the profile to unprompted reviews before you decide.
Final Verdict
Hosting customers don’t mostly complain about price. They complain about getting help: 67.8% of the complaints we sorted mention support, and only 5.4% name a renewal price or a price rise. When money does come up, it’s usually a charge, a refund or a renewal that went through after cancelling.
For buyers who need a human fast, the warning signs are AI-first chat and low reply rates. Hostinger led on AI complaints at 36.5%. OVHcloud, DigitalOcean and netcup each answered fewer than two in three complaints. For server buyers, the risk is account blocks and billing, not renewals, so Hetzner and DigitalOcean deserve the most care at sign-up. For business sites, look past the uptime number on the homepage and read the terms. DigitalOcean credits 100% of an affected Droplet’s charges, while Verpex promises only to “endeavour”.
Most of all, read a host’s unprompted reviews before its score. Invited reviews averaged 4.83 stars; unprompted ones averaged 3.65. Both are real, and the second group is the one that knows what happens when something breaks.
Related reading: our reviews of Hostinger, Hetzner, DigitalOcean and InMotion Hosting go deeper on the hosts this study named most. Still choosing? Our hosting finder asks about your traffic, location and platform, then suggests plans to compare.